Ranking Round Robin Toughness (Kumail Zaidi)
Method
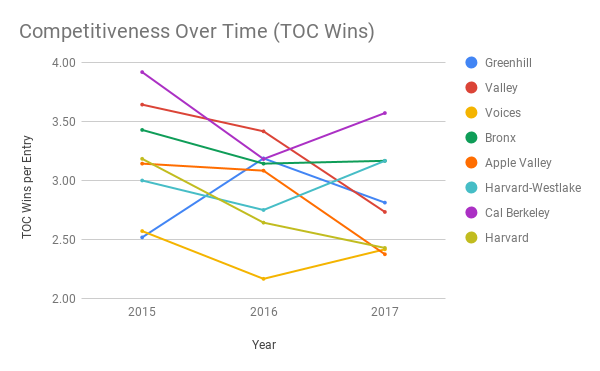
I pulled entry lists from round robins over the past three debate seasons (2015-16, 2016-17, and 2017-18). Some round robins didn’t run all three years (e.g. Lake Highland), and some didn’t have public entry lists for all three years (e.g. Blue Key, Newark), so I couldn’t include them and still have consistent data. I also included only round robins associated with bid tournaments. The final list includes Greenhill, Valley, Voices, Bronx, Apple Valley, Harvard-Westlake, Cal Berkeley, and Harvard.
To measure competitiveness, I took the average number of TOC prelim wins and TOC bids per entry across the three years for each round robin. This has a couple drawbacks because some debaters don’t go to many bid tournaments and some don’t go to TOC but are still excellent debaters. Any measure of competitiveness will have some flaws, but this seemed like a pretty objective and generally agreed-upon measure. Meadows coach Tim Alderete previously used these measures (among others) for assessing bid tournaments, which you can see here.
Round Robin Data (2015/16 – 2017/18)
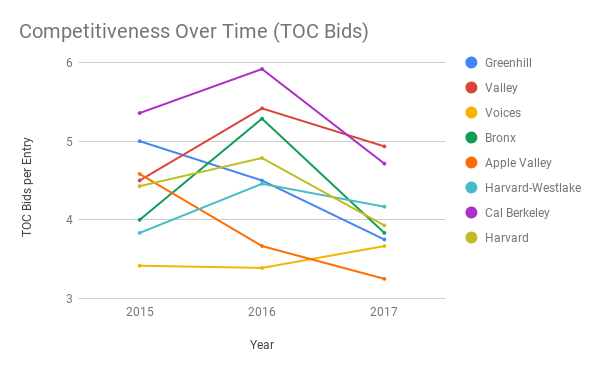
| TOC Wins per Entry | Rank | TOC Bids per Entry | Rank | |
| Greenhill | 2.84 | #6 | 4.42 | #3 |
| Valley | 3.26 | #2 | 4.95 | #2 |
| Voices | 2.38 | #8 | 3.48 | #8 |
| Bronx | 3.25 | #3 | 4.4 | #4 |
| Apple Valley | 2.87 | #5 | 3.91 | #7 |
| Harvard-Westlake | 2.97 | #4 | 4.27 | #6 |
| Cal Berkeley | 3.56 | #1 | 5.30 | #1 |
| Harvard | 2.75 | #7 | 4.38 | #5 |
Final Rankings
If we average the ranks for each round robin, this is the final ranking:
1. Cal Berkeley
2. Valley
3. Bronx
4. Greenhill
5. Harvard-Westlake
6. Apple Valley (tie)
6. Harvard (tie)
8. Voices
There are obviously other measures than these, and some round robins have different goals than maximizing the TOC-competitiveness of their entries. But hopefully this is a worthwhile contribution to discussions about round robins moving forward.

